By Harry Roberts
Harry Roberts is an independent consultant web performance engineer. He helps companies of all shapes and sizes find and fix site speed issues.
Written by Harry Roberts on CSS Wizardry.
N.B. All code can now be licensed under the permissive MIT license. Read more about licensing CSS Wizardry code samples…
N.B. This article is no longer accurate, and changes in both iOS/MacOS and WebPageTest are no longer properly reflected. Let me update this article when I get chance. In the meantime, the particularly determined among you can probably fill the gaps yourselves—good luck!
So far this year, all but one of my clients have been concerned about Google’s upcoming Web Vitals update. The client who’s bucking the trend is great, not least because it’s given me something a little different to focus on—they’re more interested in how their site fares on iOS. What makes this particularly fun for me is that iOS Safari is a completely different ballgame to Chrome, and not something many people tend to focus on. So, I’m going to share with you a handful of tips to make it a little easier should you need to do the same—and you should do the same.
Google has a pretty tight grip on the tech industry: it makes by far the most popular browser with the best DevTools, and the most popular search engine, which means that web developers spend most of their time in Chrome, most of their visitors are in Chrome, and a lot of their search traffic will be coming from Google. Everything is very Google centric.
This, of course, is exacerbated by the new Vitals announcement, whereby data from the Chrome User eXperience Report will be used to aid and influence rankings.
In short, it’s easy to see why Safari gets left out in the cold.
The moment you don’t consider Safari, you’re turning your back on all of your iOS traffic. All of it. Every browser available on iOS is simply a wrapper around Safari. Chrome for iOS? It’s Safari with your Chrome bookmarks. Every bit of iOS traffic is Safari traffic.
In short, it’s difficult to see why Safari gets left out in the cold.
This isn’t Google’s fault, and I’ve long wished that Apple would let other browsers on their platform, but that doesn’t seem likely to happen any time soon. So, we’re stuck only with Safari. That we probably aren’t testing.
It’s worth noting that, by and large, the same page will perform better in iOS Safari than it would on Android Chrome—iPhones are generally far more powerful than their Android counterparts. Further, and by chance, iOS usage is strongly correlated with regions we generally find to have better infrastructure. This means that iOS devices tend to be faster and are found in ‘faster regions’.
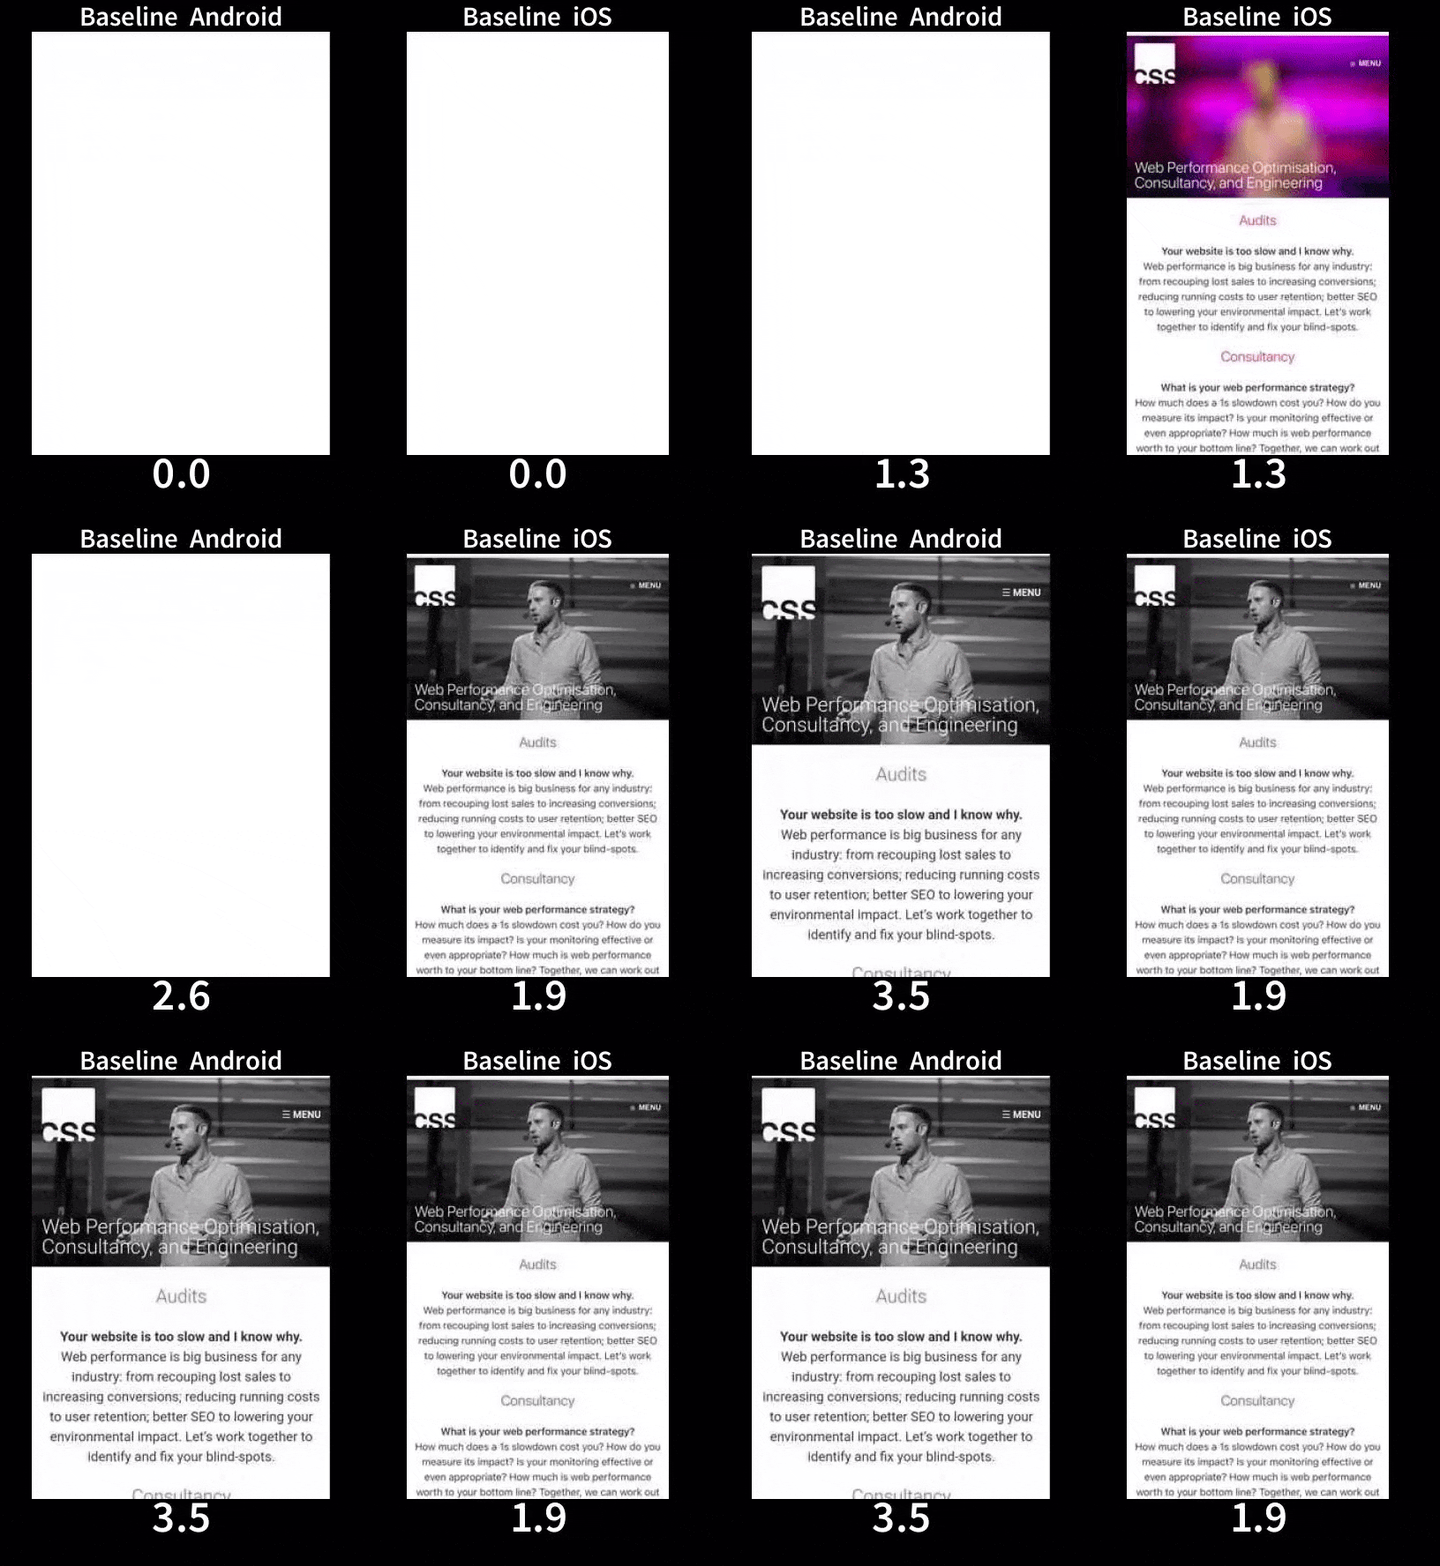
But, Can’t I Just Emulate?
No.
For better or worse, I’m an iPhone and Mac user, so I’m pretty well set up out of the gate. If you don’t have an iPhone, well, you’ll struggle to test an iPhone. But the additional need for a Mac will be a barrier to entry for many I’m afraid.
But! Fear not! It’s not the end of the line for non-Mac users. Read on.
WebPageTest is easily, by far, without a shadow of a doubt, the single most important tool when it comes to web performance. I could not do my job without it. I cannot overstate its importance. It’s vital.
So imagine how happy I am to report that it has first-class, genuine iOS device support!
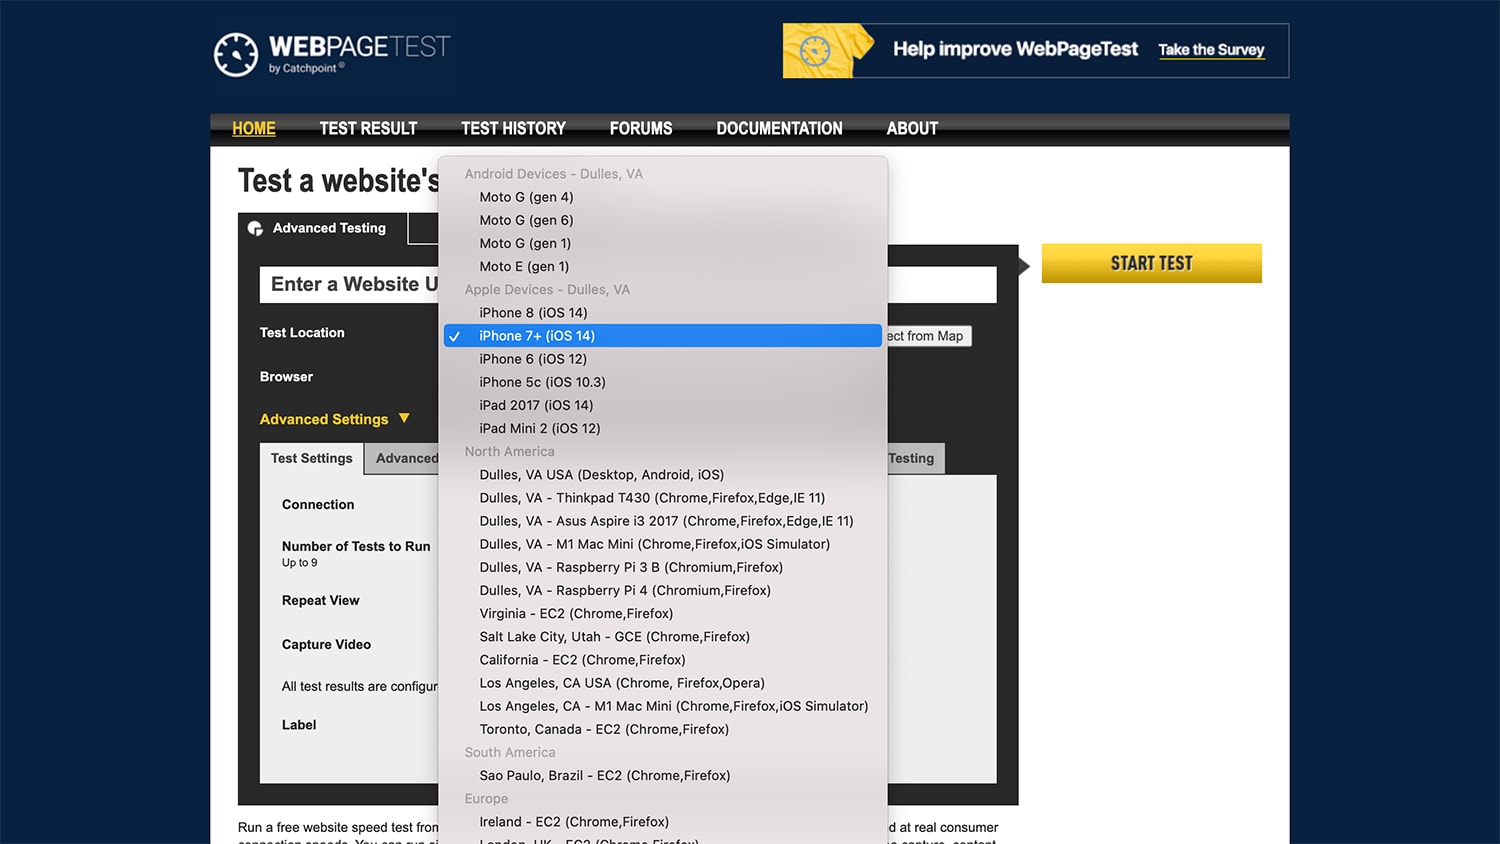
This will give you a fantastically detailed waterfall—among plenty more—that you can go back and refer to time and again.
However, there are two key caveats:
Still, this is an amazing starting point for anyone wanting to begin profiling web performance on iOS. In fact, this is something that WebPageTest has improved upon and written about only a month prior to this article you’re reading right now.
What we really want to do, alongside capturing good benchmark- and more permanent data with WebPageTest, is interact with and inspect a site slightly more realtime. Thankfully, if you have a Mac and an iPhone, this is remarkably straighforward!
N.B. This step and its sub-step are optional, but highly recommended.
Plug your iPhone into your Mac and fire up Xcode. Once its opened, go to Window » Devices and Simulators and look for your device in the resulting window.
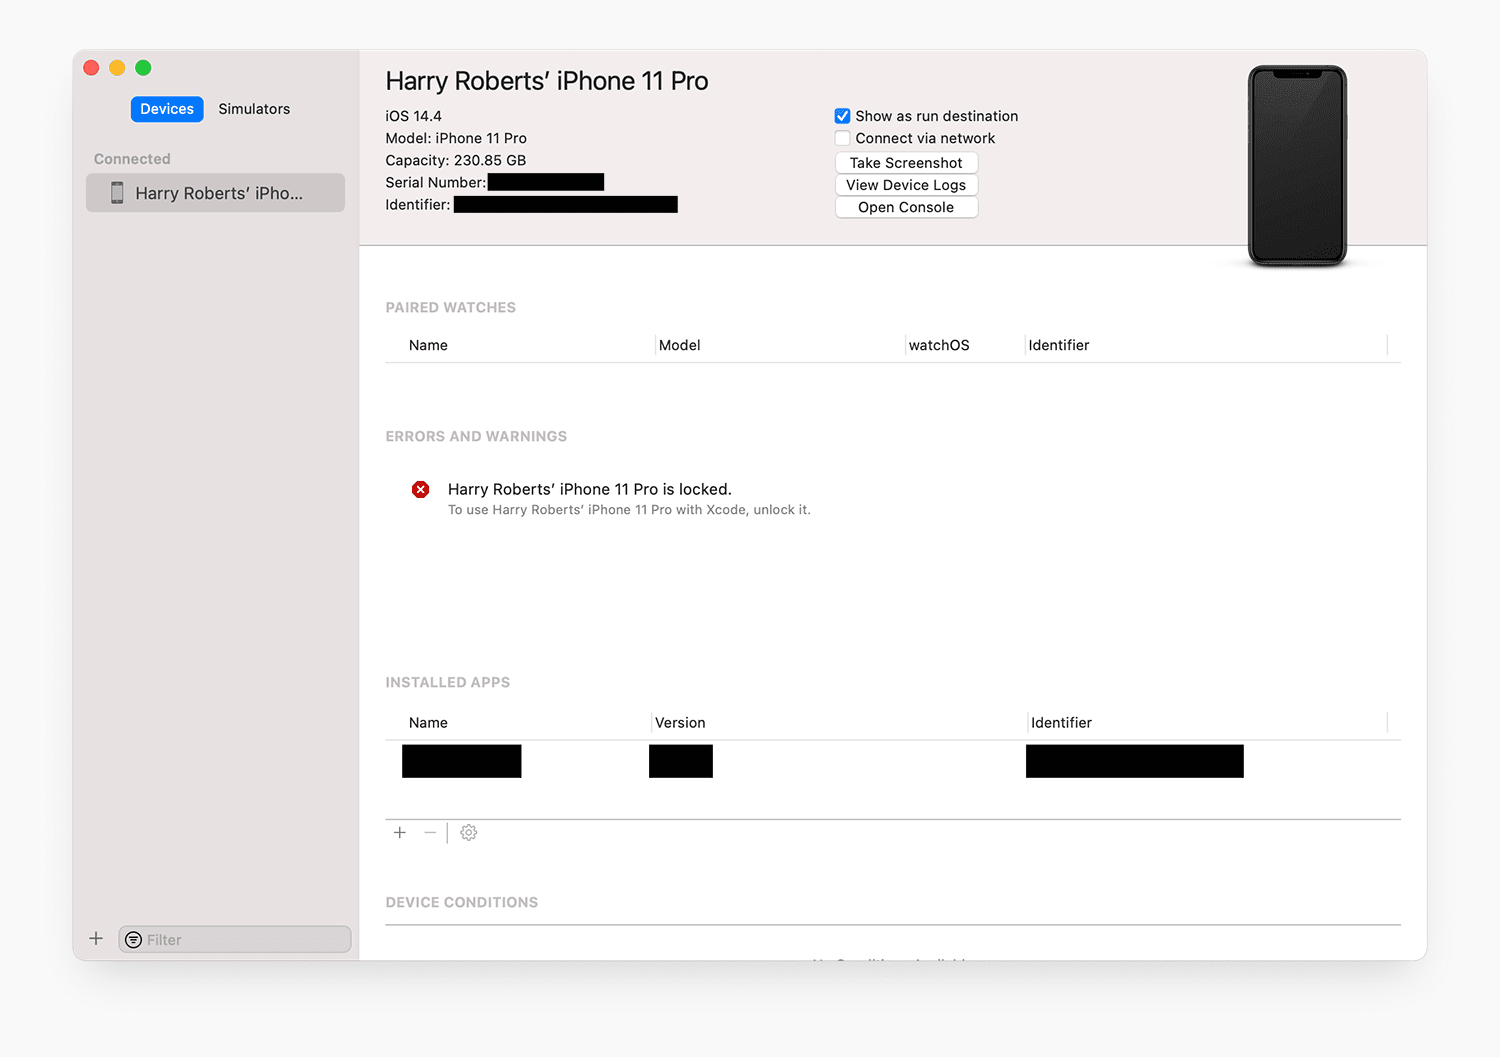
Make sure that any option or alert that pertains to running your iPhone as a development device is enabled. Truthfully, I’ve never really had to do anything more in this view than unlock my phone and maybe restart it once or twice. As long as I see this much, I can guarantee the next step will work…
I honestly can’t even believe I’m telling you this… this is so cool. Now, in iOS’ Settings app, you should find a new Developer option.
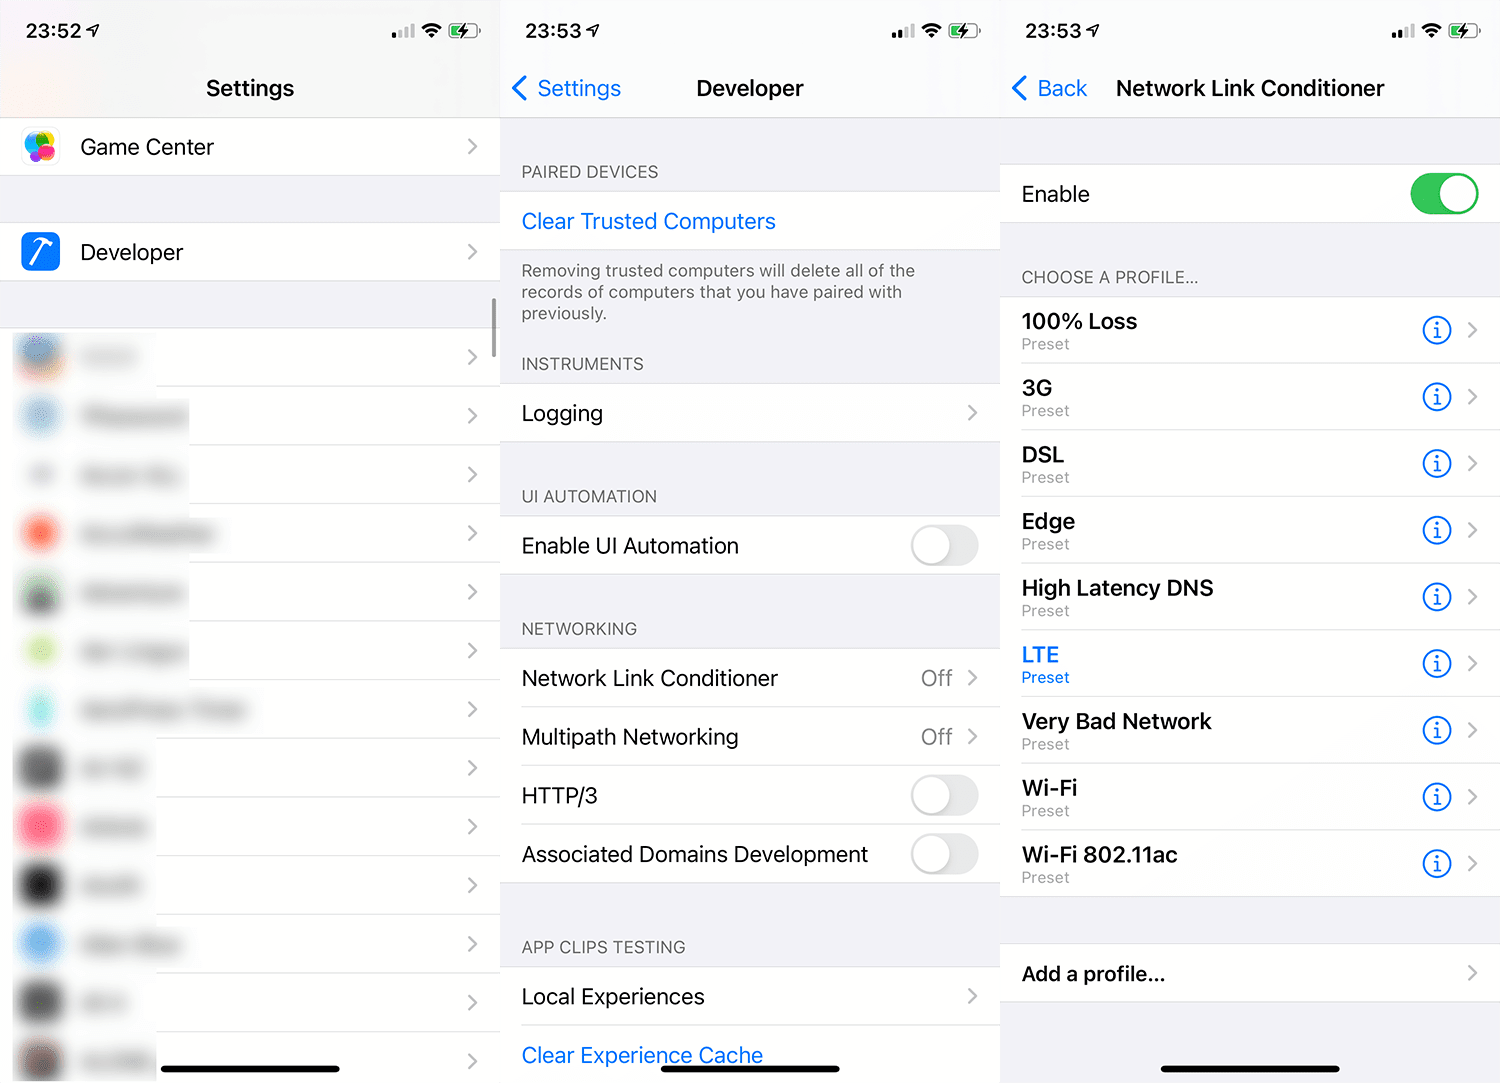
In there, you should find a tool called Network Link Conditioner. This provides us with very accurate network throttling via a number of handy presets, or you can configure your own. This means that, even if you’re connected to the office wifi, you can still simulate slower (and very realistic) connection speeds.
Next, in Safari’s settings on iOS, head to Advanced and enable Web Inspector. That’s it! You’re good to go.
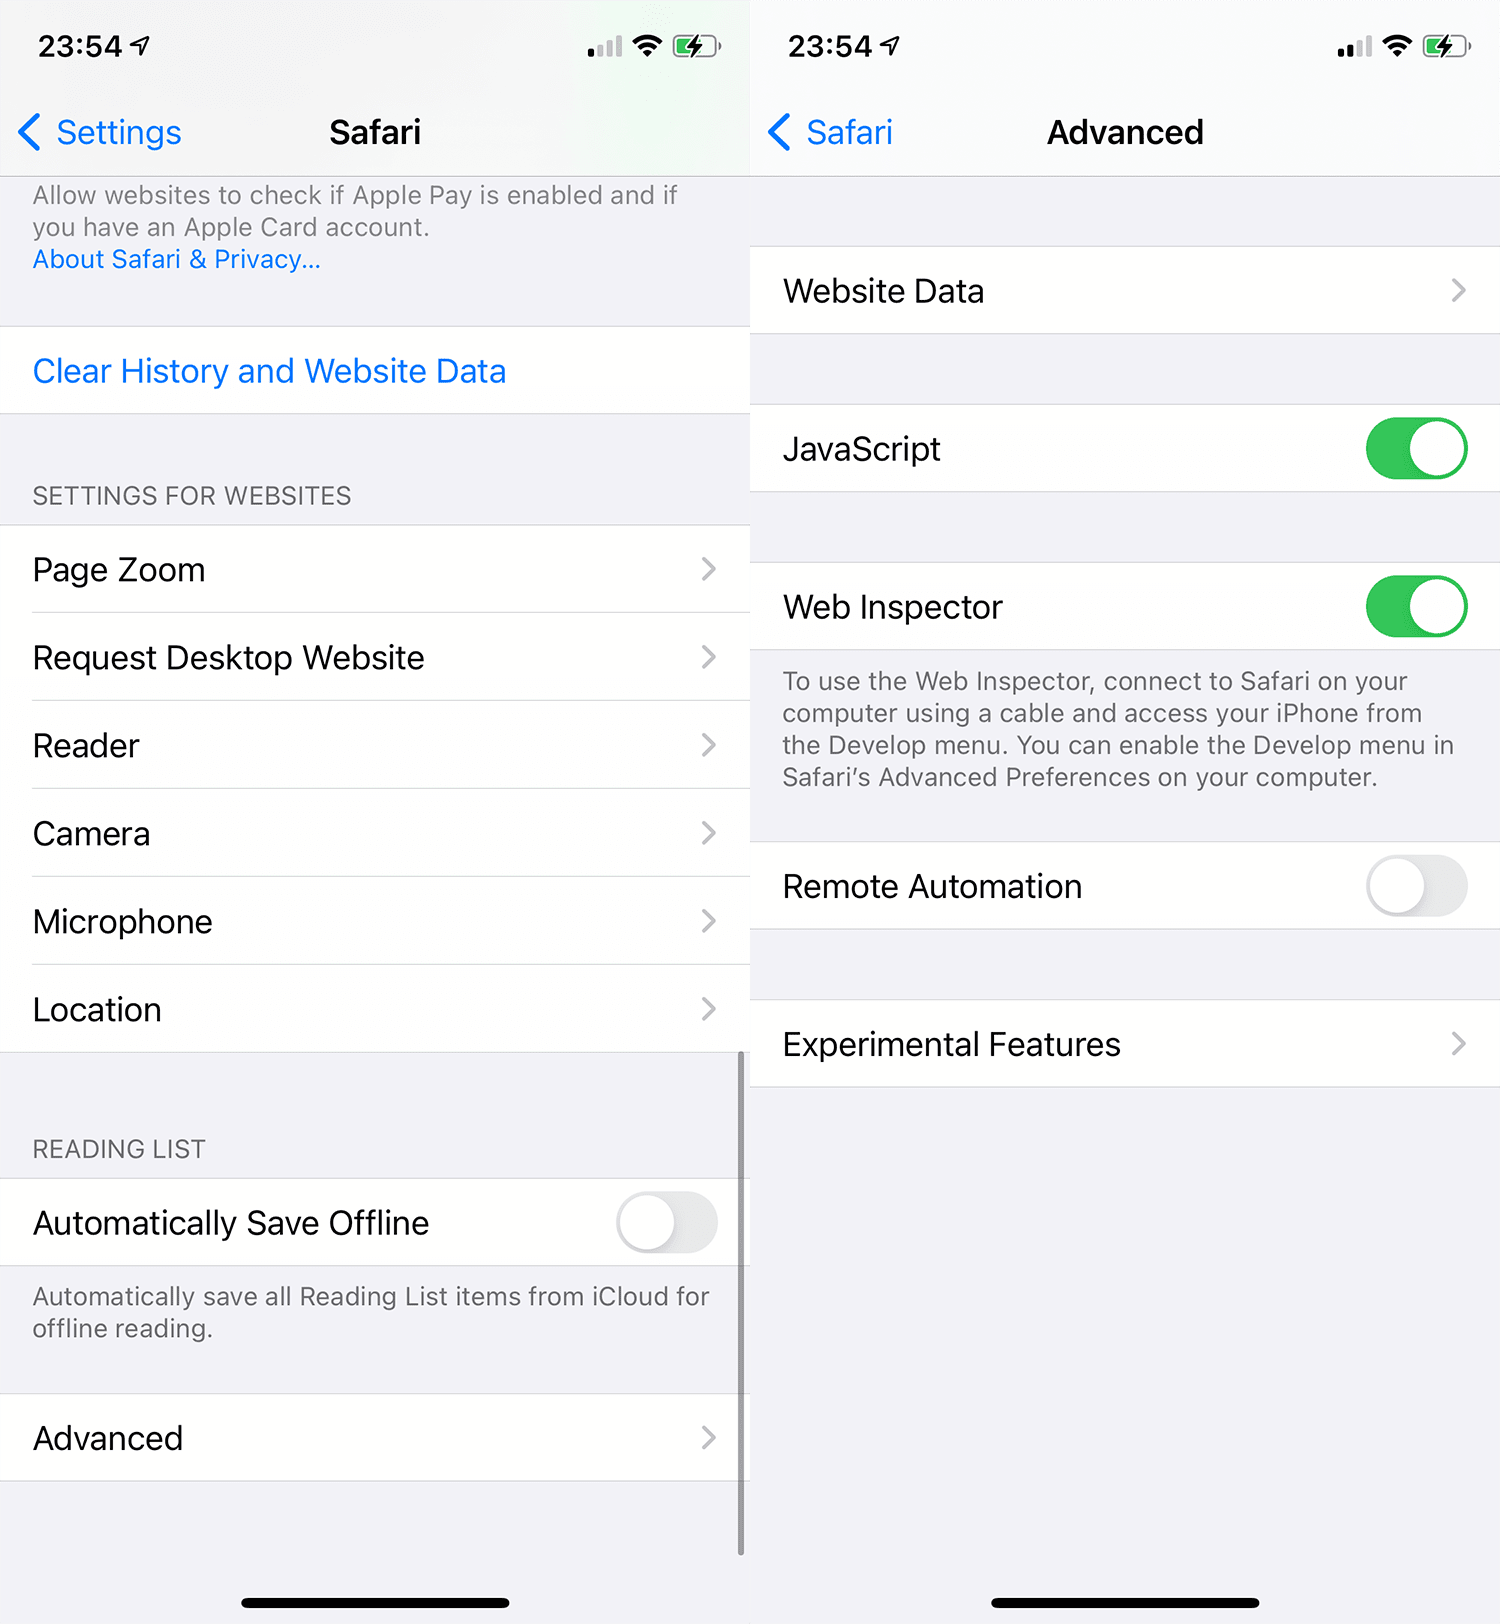
This will allow your desktop version of Safari to inspect the current tab of your iPhone’s Safari instance.
Now open Safari. I know, you haven’t opened it in a while, so hit ⌘⎵ and type Safari. Head to Develop and look out for your device in the dropdown menu.
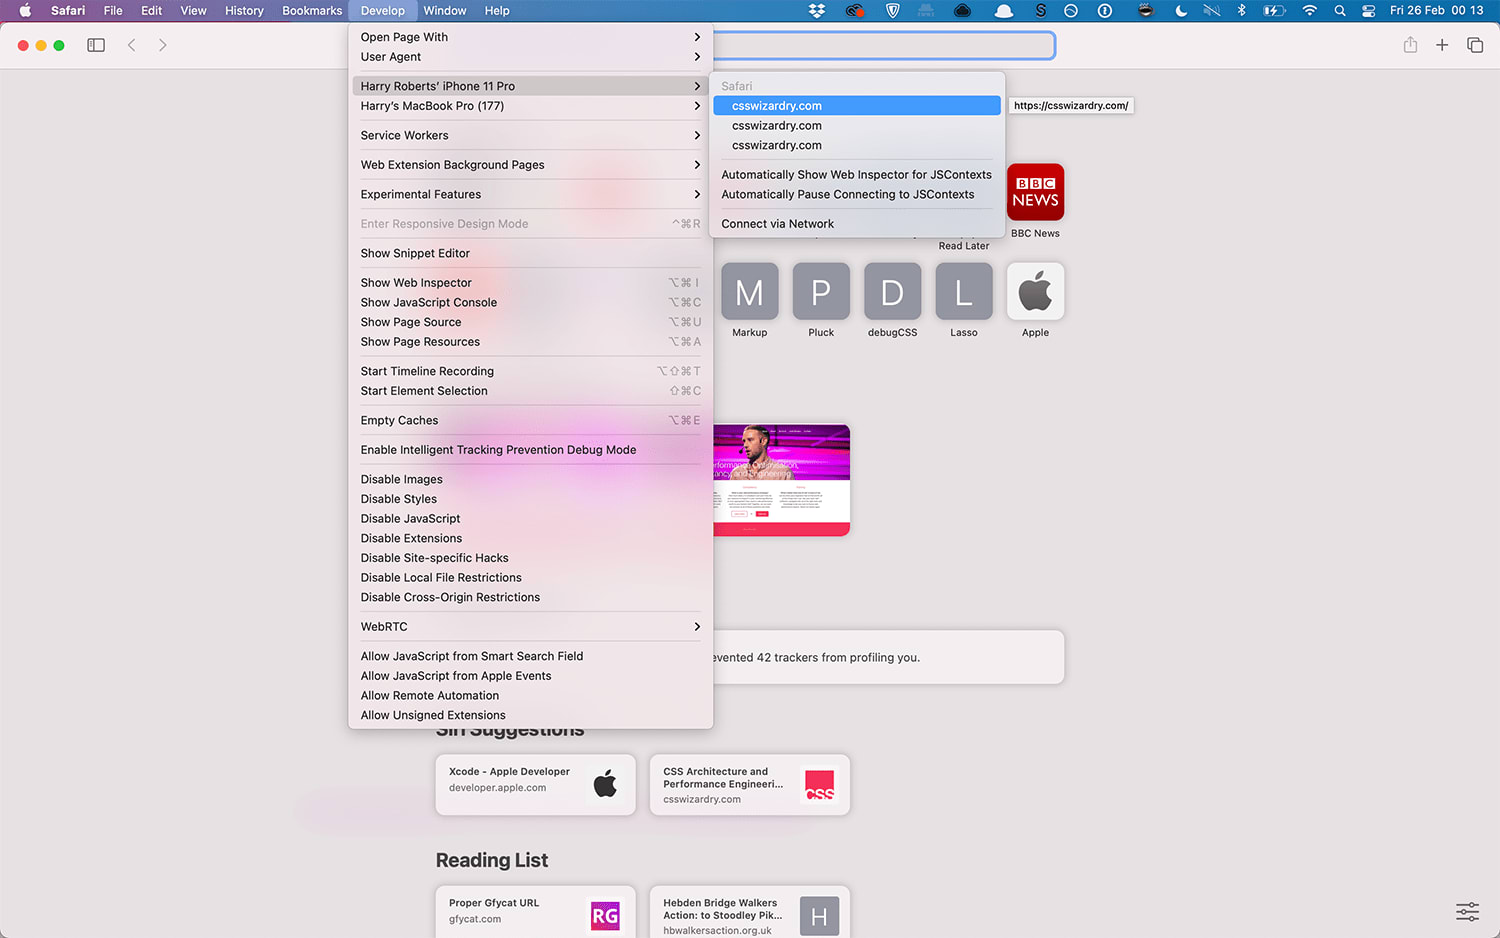
…and that’s it. That’s really it. You’re now inspecting your phone from Safari’s desktop DevTools:
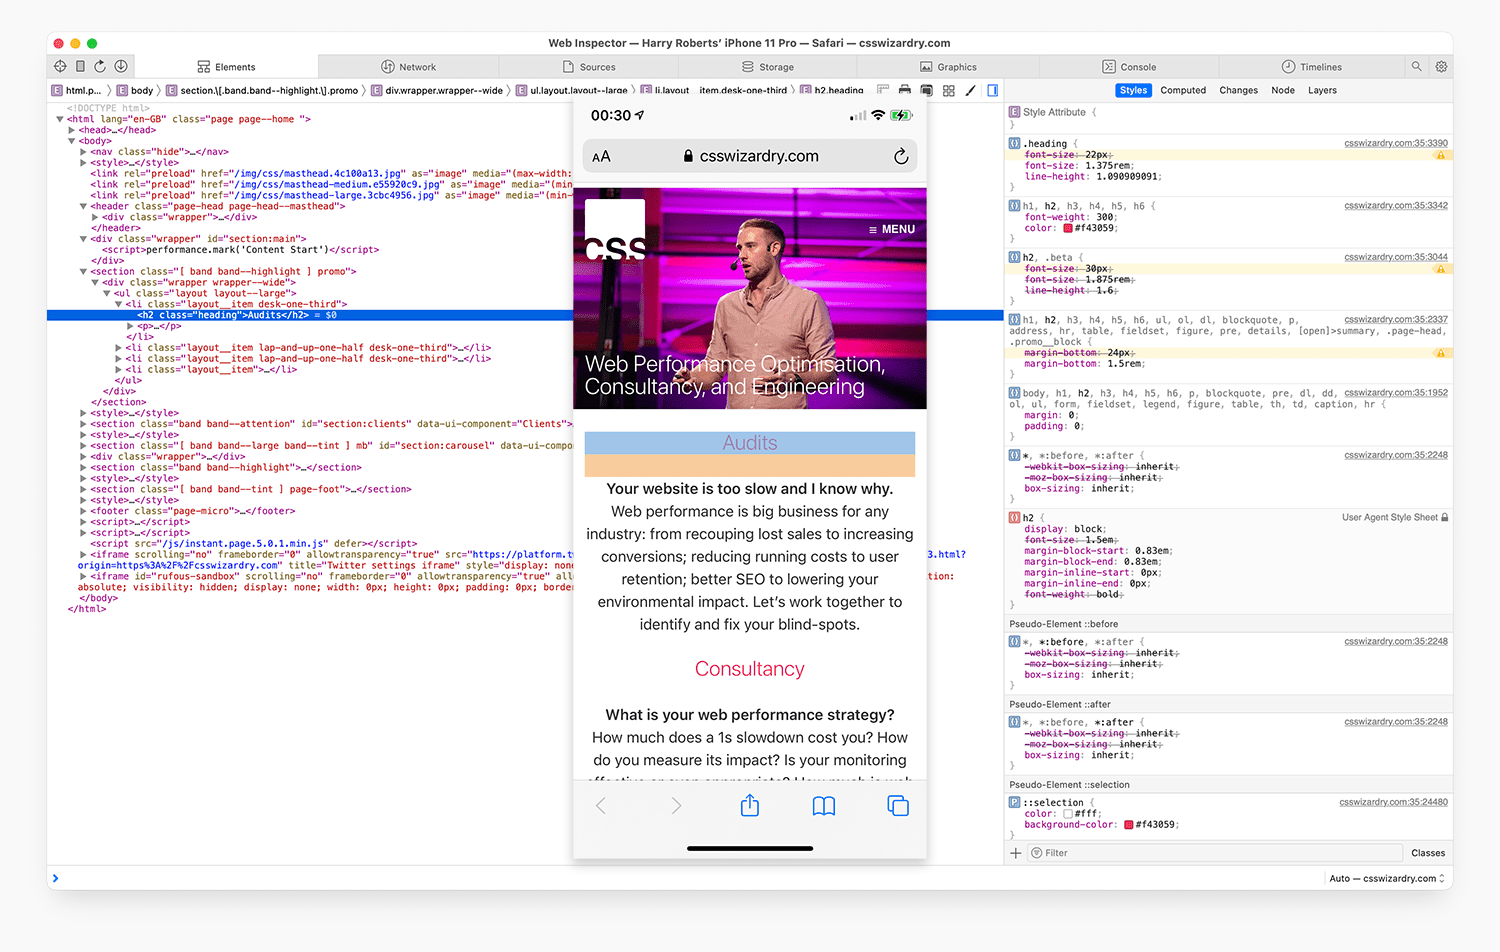
As long as your phone stays unlocked and with the webpage in question active, you can inspect the iOS device as you would desktop. Neat!
Of course, the whole point of this article is performance profiling, so let’s move over to the Network tab. If you’re used to Chrome’s Network tab then, well, I’m sorry.
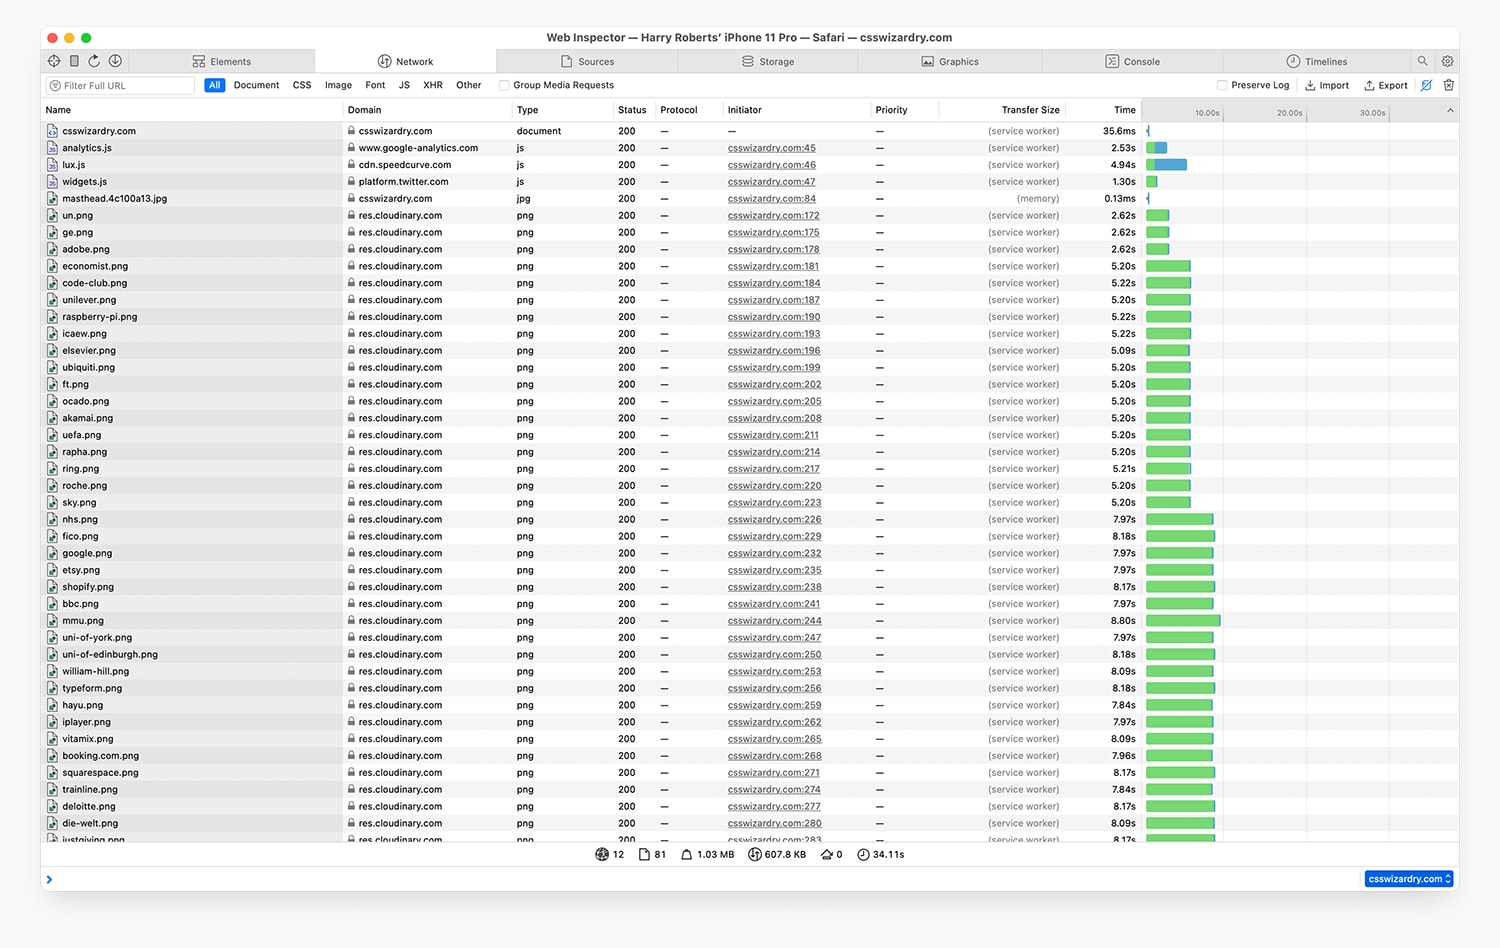
Here is how my actual iPhone on a throttled connection deals with my website. There are some truly fascinating differences between how Chrome and Safari work, visible even on a scale as small as this. It really helps drive home the importance of testing each platform in its own right, and explains why you can’t simply emulate an iPhone in Chrome’s DevTools.
But! That said. Chrome’s DevTools are far, far better than Safari’s, so we might as well use that to our advantage, right?
Export the HAR (Http ARchive) file from Safari’s Network panel and save it
on your desktop where it will remain until you buy a new machine
somewhere sensible. Next, open Chrome and its own Network DevTools panel.
Import the HAR file here.
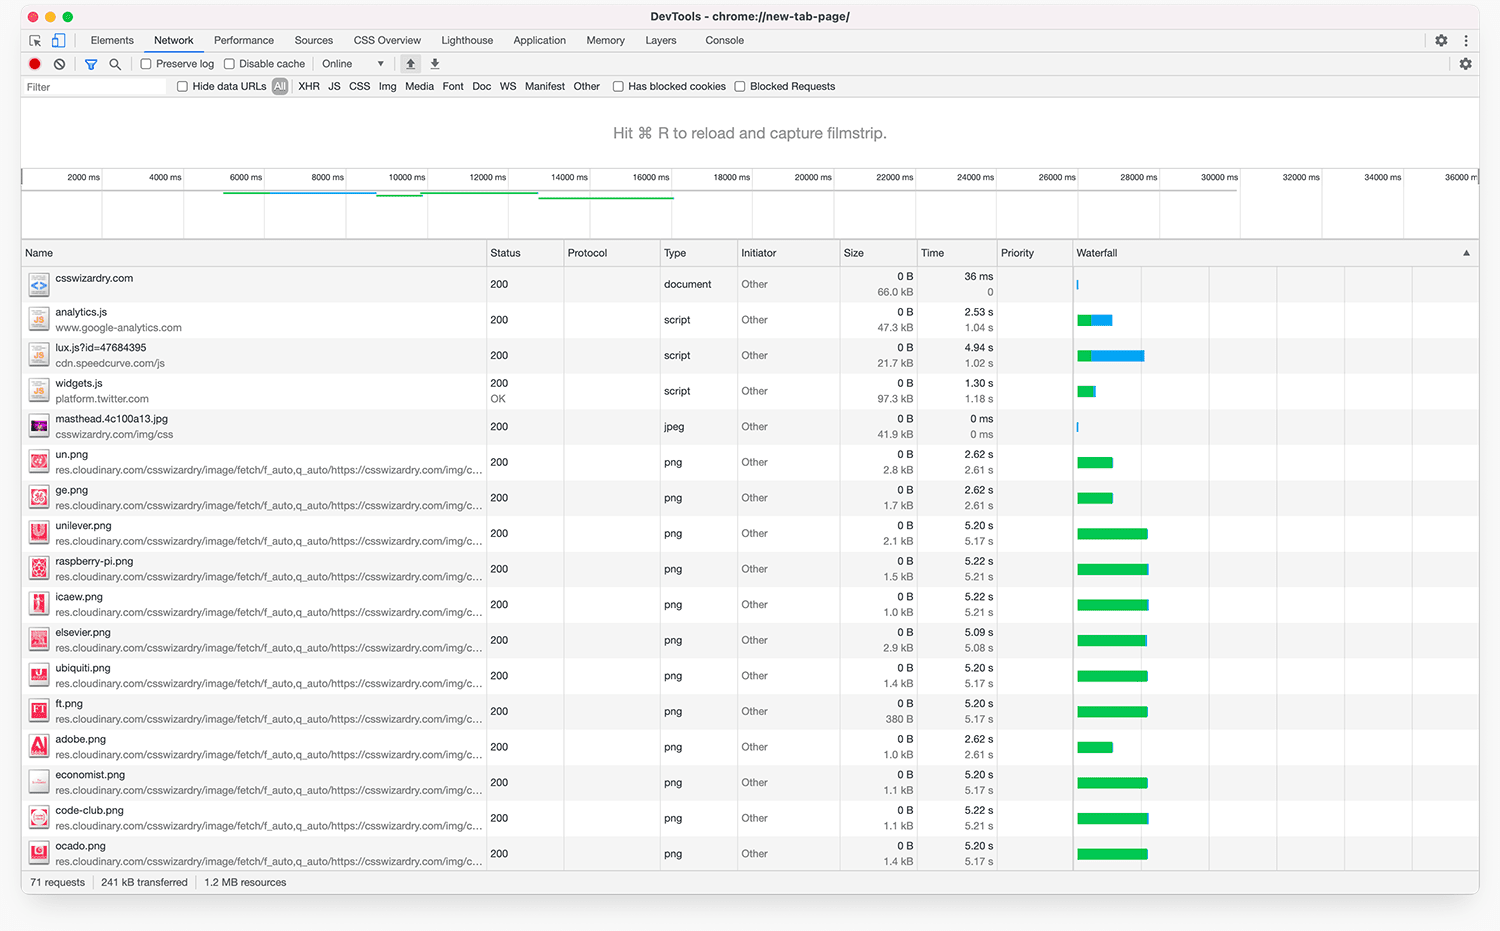
This is key: Safari captures less data than Chrome, which is a problem. Simply opening this file in Chrome’s DevTools doesn’t make the data itself better, but it does allow us to interrogate it far better. It’s basically just a far nicer workflow onto the data provided by Safari.
If you want to know more about how best to use DevTools for performance testing, I’m running a workshop with Smashing Magazine real soon, and that will make you DevTools experts. You can still grab tickets.
With iOS generally being faster, and Vitals being entirely Chrome centric, and most emerging economies being Android-led, it might seem redundant to test performance at all on iOS. In fact, it’s a relatively safe assumption that if you’re fast on, say, a Moto G4, you’ll be blazing fast on an iPhone. But still, given the sheer prevalence of iOS, it’s wise to be aware of what might currently be a total blind-spot.
While it’s unlikely to become your default process, it’s important to know how to do it. And now you do.
Still worried about Vitals? Drop me a line! There’s still a little while before the May update.
N.B. All code can now be licensed under the permissive MIT license. Read more about licensing CSS Wizardry code samples…
Harry Roberts is an independent consultant web performance engineer. He helps companies of all shapes and sizes find and fix site speed issues.

Hi there, I’m Harry Roberts. I am an award-winning Consultant Web Performance Engineer, designer, developer, writer, and speaker from the UK. I write, Tweet, speak, and share code about measuring and improving site-speed. You should hire me.
You can now find me on Mastodon.


I help teams achieve class-leading web performance, providing consultancy, guidance, and hands-on expertise.
I specialise in tackling complex, large-scale projects where speed, scalability, and reliability are critical to success.