By Harry Roberts
Harry Roberts is an independent consultant web performance engineer. He helps companies of all shapes and sizes find and fix site speed issues.
Written by Harry Roberts on CSS Wizardry.
N.B. All code can now be licensed under the permissive MIT license. Read more about licensing CSS Wizardry code samples…
I’m working on a client project at the moment and, as they’re an ecommerce site,
there are a lot of facets of performance I’m keen to look into for them: load
times are a good start, start render is key for customers who want to see
information quickly (hint: that’s all of them), and client-specific metrics like
how quickly did the key product image load?
can all provide valuable
insights.
However, one metric I feel that front-end developers overlook all too quickly is Time to First Byte (TTFB). This is understandable—forgivable, almost—when you consider that TTFB begins to move into back-end territory, but if I was to sum up the problem as succinctly as possible, I’d say:
While a good TTFB doesn’t necessarily mean you will have a fast website, a bad TTFB almost certainly guarantees a slow one.
Even though, as a front-end developer, you might not be in the position to make improvements to TTFB yourself, it’s important to know that any problems with a high TTFB will leave you on the back foot, and any efforts you make to optimises images, clear the critical path, and asynchronously load your webfonts will all be made in the spirit of playing catchup. That’s not to say that more front-end oriented optimisations should be forgone, but there is, unfortunately, an air of closing the stable door after the horse has bolted. You really want to squish those TTFB bugs as soon as you can.
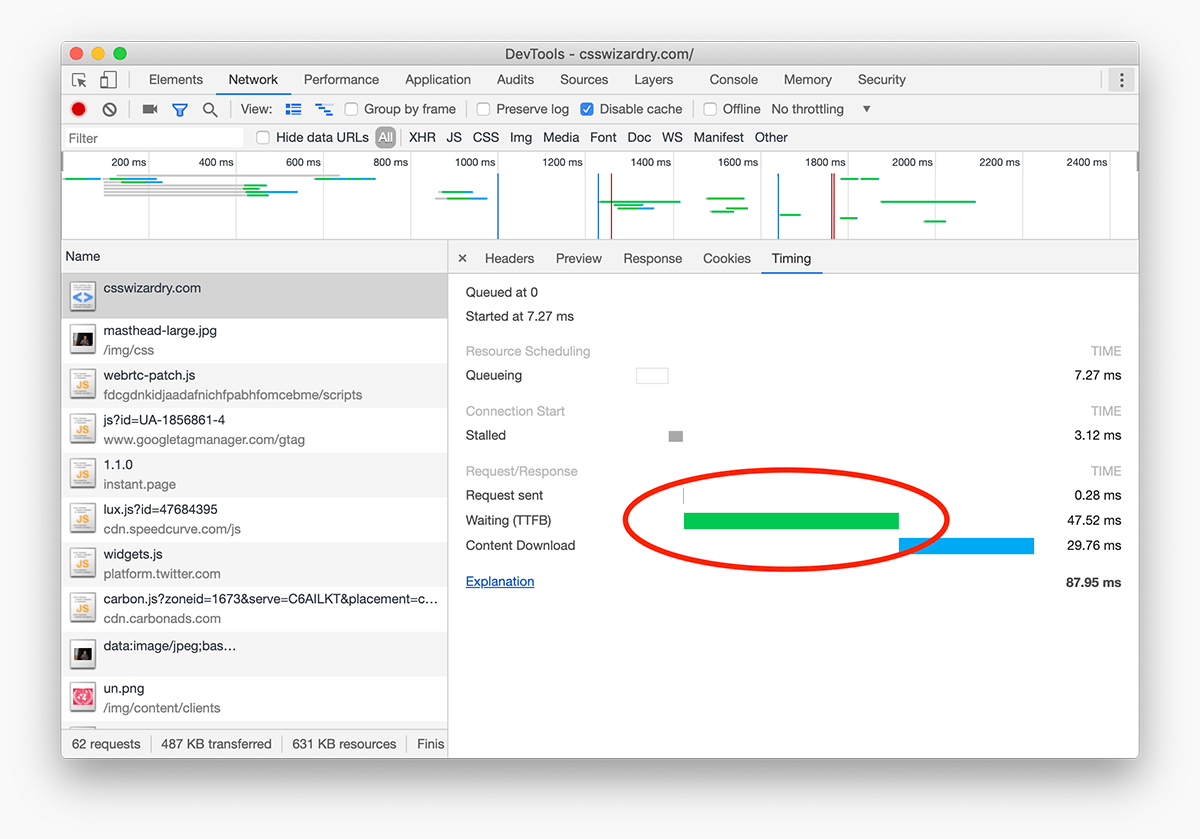
TTFB is a little opaque to say the least. It comprises so many different things that I often think we tend to just gloss over it. A lot of people surmise that TTFB is merely time spent on the server, but that is only a small fraction of the true extent of things.
The first—and often most surprising for people to learn—thing that I want to draw your attention to is that TTFB counts one whole round trip of latency. TTFB isn’t just time spent on the server, it is also the time spent getting from our device to the sever and back again (carrying, that’s right, the first byte of data!).
Armed with this knowledge, we can soon understand why TTFB can often increase so
dramatically on mobile. Surely, you’ve wondered before, the server has no
idea that I’m on a mobile device—how can it be increasing its TTFB?!
The
reason is because mobile networks are, as a rule, high latency connections. If
your Round Trip Time (RTT) from your phone to a server and back again is, say,
250ms, you’ll immediately see a corresponding increase in TTFB.
If there is one key thing I’m keen for your to take from this post, its is that TTFB is affected by latency.
But what else is TTFB? Strap yourself in; here is a non-exhaustive list presented in no particular order:
It’s impossible to have a 0ms TTFB, so it’s important to note that the list above does not represent things that are necessarily bad or slowing your TTFB down. Rather, your TTFB represents any number of the items present above. My aim here is not to point fingers at any particular part of the stack, but instead to help you understand what exactly TTFB can entail. And with so much potentially taking place in our TTFB phase, it’s almost a miracle that websites load at all!
So. Much. Stuff!
Thankfully, it’s not all so unclear anymore! With a little bit of extra work spent implementing the Server Timing API, we can begin to measure and surface intricate timings to the front-end, allowing web developers to identify and debug potential bottlenecks previously obscured from view.
The Server Timing API allows developers to augment their responses with an
additional Server-Timing HTTP header which contains timing information that
the application has measured itself.
This is exactly what we did at BBC iPlayer last year:
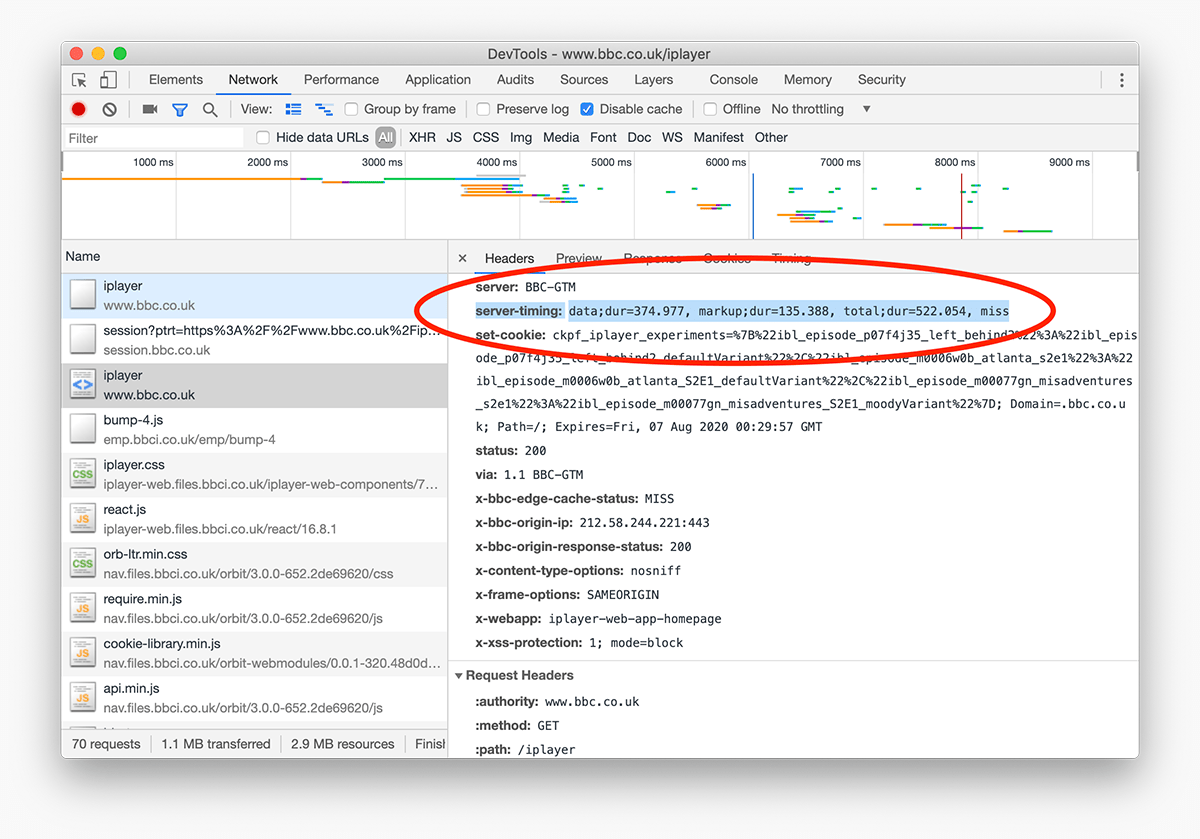
Server-Timing header can be added
to any response. View full
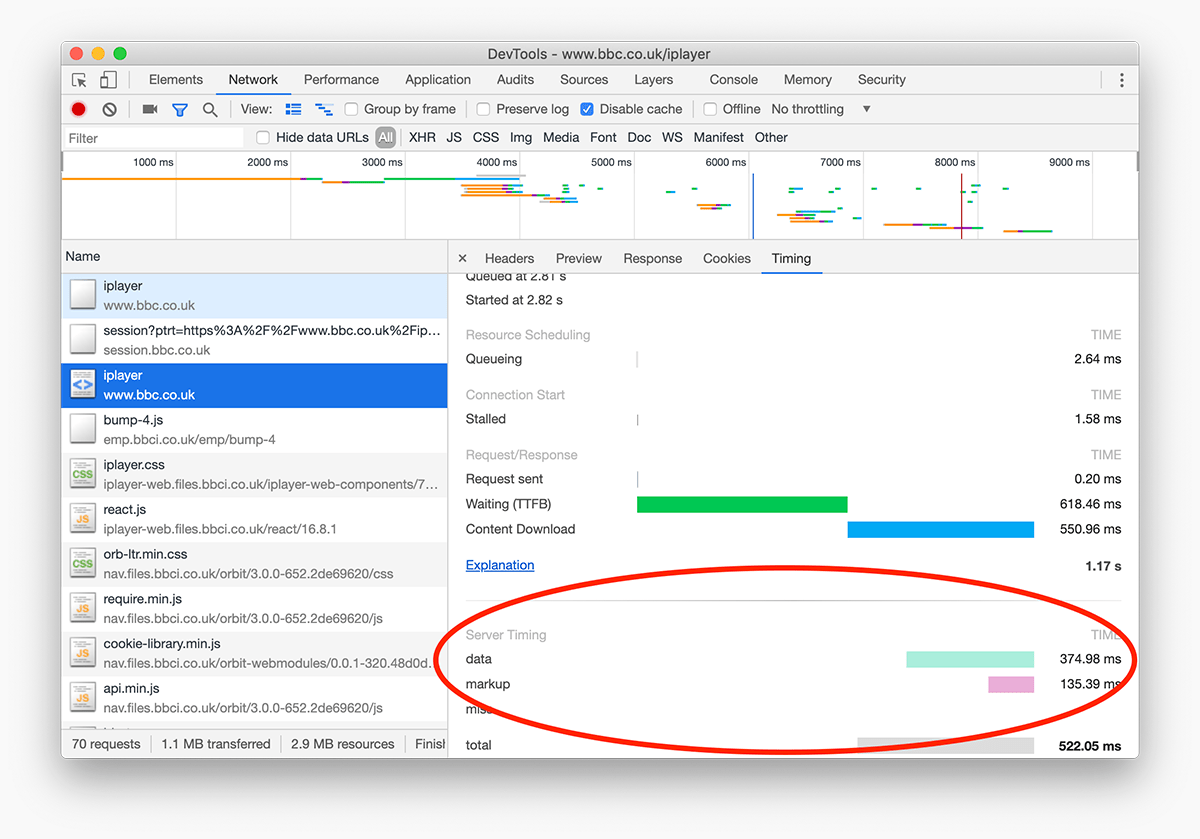
size/quality (533KB)N.B. Server Timing doesn’t come for free: you need to actually measure the
aspects listed above yourself and then populate your Server-Timing header with
the relevant data. All the browser does is display the data in the relevant
tooling, making it available on the front-end:
To help you get started, Christopher Sidebottom wrote up his implementation of the Server Timing API during our time optimising iPlayer.
It’s vital that we understand just what TTFB can cover, and just how critical it can be to overall performance. TTFB has knock-on effects, which can be a good thing or a bad thing depending on whether it’s starting off low or high.
If you’re slow out of the gate, you’ll spend the rest of the race playing catchup.
N.B. All code can now be licensed under the permissive MIT license. Read more about licensing CSS Wizardry code samples…
Harry Roberts is an independent consultant web performance engineer. He helps companies of all shapes and sizes find and fix site speed issues.

Hi there, I’m Harry Roberts. I am an award-winning Consultant Web Performance Engineer, designer, developer, writer, and speaker from the UK. I write, Tweet, speak, and share code about measuring and improving site-speed. You should hire me.
You can now find me on Mastodon.


I help teams achieve class-leading web performance, providing consultancy, guidance, and hands-on expertise.
I specialise in tackling complex, large-scale projects where speed, scalability, and reliability are critical to success.