By Harry Roberts
Harry Roberts is an independent consultant web performance engineer. He helps companies of all shapes and sizes find and fix site speed issues.
Written by Harry Roberts on CSS Wizardry.
N.B. All code can now be licensed under the permissive MIT license. Read more about licensing CSS Wizardry code samples…
When it comes to network performance, there are two main limiting factors that will slow you down: bandwidth and latency.
Bandwidth is defined as…
…the maximum rate of data transfer across a given path.
Generally speaking, increased bandwidth is only particularly useful when you’re transferring or downloading large files. If you’re streaming video, the difference between a 2Mb1 connection and a 20Mb connection will surely be appreciated. If you’re browsing the web—with most pages constructed of much smaller files—then the same change in bandwidth may not be felt quite as much.
Latency is defined as…
…how long it takes for a bit of data to travel across the network from one node or endpoint to another.
Where bandwidth deals with capacity, latency is more about speed of transfer2. As a web user—often transferring lots of smaller files—reductions in latency will almost always be a welcome improvement.
So, although it is widely accepted that, at least for regular web browsing, latency is the bigger bottleneck3, it still pays to be aware of whether it is latency or indeed bandwidth that is slowing down a particular file.
In this quick post, I want to share a little DevTools tip that I go through in my performance workshops: a simple way to quickly and roughly work out whether your assets would benefit most from an increase in bandwidth or a reduction in latency, which actually brings me onto my first point:
It’s something of a misnomer to use phrases like increase in bandwidth
and reduction in latency
. We don’t really have the ability to simply
‘increase bandwidth’—although that would be nice!—so what we’re really looking
to do is reduce the amount of transfer. Similarly, there isn’t much we can do to
really ‘reduce latency’, but we can avoid
latency
by perhaps moving our assets closer to the client (e.g. a CDN) or mitigating
network overhead (e.g. with Resource Hints).
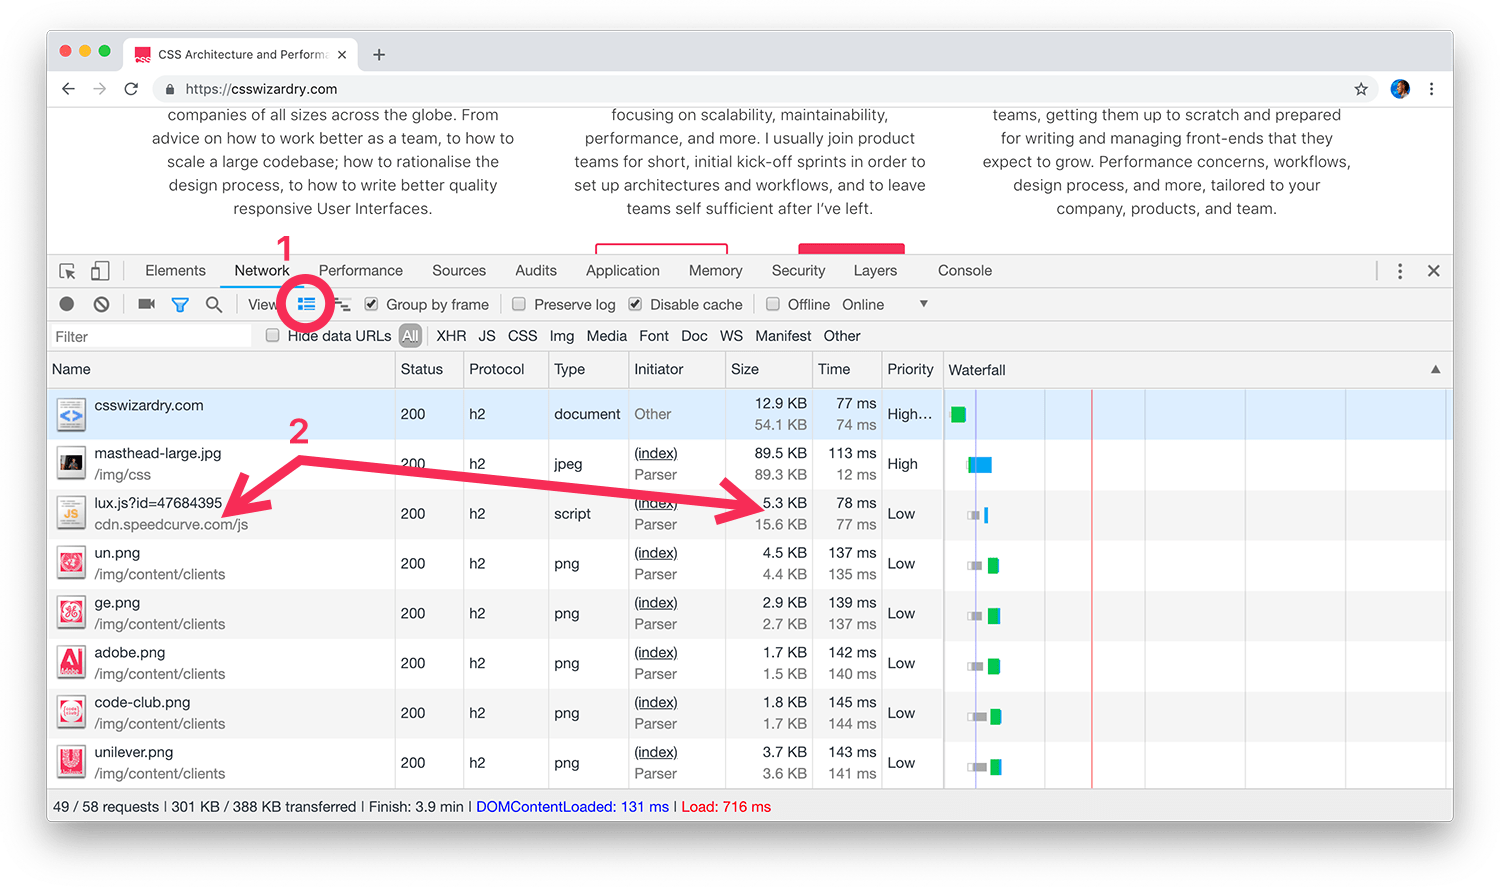
In order to make use of this little tip, we’re going to need to enable Large Request Rows (1) in Chrome’s Network panel. This will then double up the height of each entry in out waterfall chart, thus displaying a little more detail (2).

Why this isn’t the default view, I will never know—there is so much useful extra information here!
There are a lot of different phases involved in getting from the point of requesting a file until we’re able to begin downloading it. Once resources have been discovered, their outgoing requests may need to be scheduled, the browser might need to perform a DNS lookup to determine the resource’s origin’s IP address, we’ll then need to open up a TCP connection to that origin, hopefully we’re running over a secure connection that will incur some TLS negotiation, and then once we’re on the server we deal with Time to First Byte (TTFB)4, which includes time spent on the server and the time taken for the first byte of data to traverse the network and end up back on the machine.
That’s a lot of work, and with smaller files, it may be unsurprising to learn that negotiating all of that network overhead can often take longer than the content download itself.

Let’s take another look at our screenshot above. Focus on the first entry, the
HTML payload for csswizardry.com. In its Time cell you’ll see a total
duration of 77ms, and a latency value of 74ms. Subtracting the bottom from the
top value gives us 3ms. It took only 3ms to download this file, yet 74ms to
negotiate the network.
Put another way, latency cost us 24.6× more than bandwidth for this resource. By far the biggest limiting factor here was latency.
Put another other way, reducing the size of this file is unlikely to make it arrive any sooner. This isn’t a file whose size we should look to optimise.
Look at the second entry, masthead-large.jpg. Taking its total value of 113ms
and subtracting its latency of (a very miniscule!) 12ms, we’ll see that 101ms
was spent downloading this file.
Put another way, bandwidth cost us 8.4× more than latency. This is a resource where a reduction in filesize would lead to quicker delivery.
Looking at the next entry, lux.js from SpeedCurve,
we’ll see a total time of 78ms and a latency count of 77ms. Just one millisecond
to download this file—amazing! Reducing its size is really going to make so
little difference.
Finally, looking at the last five image requests, we see that all of their latency times sit around 140ms while their download times are at 2ms. If I wanted to speed up the delivery of these images, I am unlikely to get any real gains through optimising them further.
The waterfall I used as a demo was exactly that—a demo. It’s vital that you run your own tests several times and across a range of different network conditions to assess how key resources respond.
A good rule of thumb to remember is that, for regular web browsing, improvements in latency would be more beneficial than improvements in bandwidth, and that improvements in bandwidth are noticed more when dealing with larger files.
Beware the difference between Mb and MB. An 8Mb connection equates to only 1 megabyte of data. Sneaky ISPs. ↩
ISPs have also done a lot of harm here by conflating bandwidth and speed in their marketing efforts. ↩
MIT News: System loads Web pages 34 percent faster by fetching files more effectively ↩
TTFB can be a bit of a black box, and could measure anything including latency, filesystem reads, CPU cycles, database reads, statically rendering pages, API calls, routing, and more. To help demystify it, look at the Server Timing API. ↩
N.B. All code can now be licensed under the permissive MIT license. Read more about licensing CSS Wizardry code samples…
Harry Roberts is an independent consultant web performance engineer. He helps companies of all shapes and sizes find and fix site speed issues.

Hi there, I’m Harry Roberts. I am an award-winning Consultant Web Performance Engineer, designer, developer, writer, and speaker from the UK. I write, Tweet, speak, and share code about measuring and improving site-speed. You should hire me.
You can now find me on Mastodon.


I help teams achieve class-leading web performance, providing consultancy, guidance, and hands-on expertise.
I specialise in tackling complex, large-scale projects where speed, scalability, and reliability are critical to success.