By Harry Roberts
Harry Roberts is an independent consultant web performance engineer. He helps companies of all shapes and sizes find and fix site speed issues.
Written by Harry Roberts on CSS Wizardry.
N.B. All code can now be licensed under the permissive MIT license. Read more about licensing CSS Wizardry code samples…
When building almost any website of any reasonable size, we’re highly likely to need to call on at least some third party resources: analytics, fonts, CDNs, ad providers, to name just a few.
Unfortunately, this puts a lot of your ability to be fast in someone else’s
hands, and the vast majority of performance slowdowns I encounter in my work
are, indeed, caused by external resources that we have little-to-no control
over. These issues could range from network issues on a CDN leading to slower
delivery of assets, to external JavaScript using older APIs like
document.write(); from third parties not properly compressing or caching their
resources, to ad networks not optimising their images; from third party
resources living on the Critical Path, to any combination of the above.
The solutions to the above problems will range from trivial to non-existent and will depend a lot on the third party in question, and on your own context. That means that, in this post, I can’t necessarily discuss how to fix these issues, but I will show you a few tools you can use to identify and triage them and learn just how susceptible you might be.
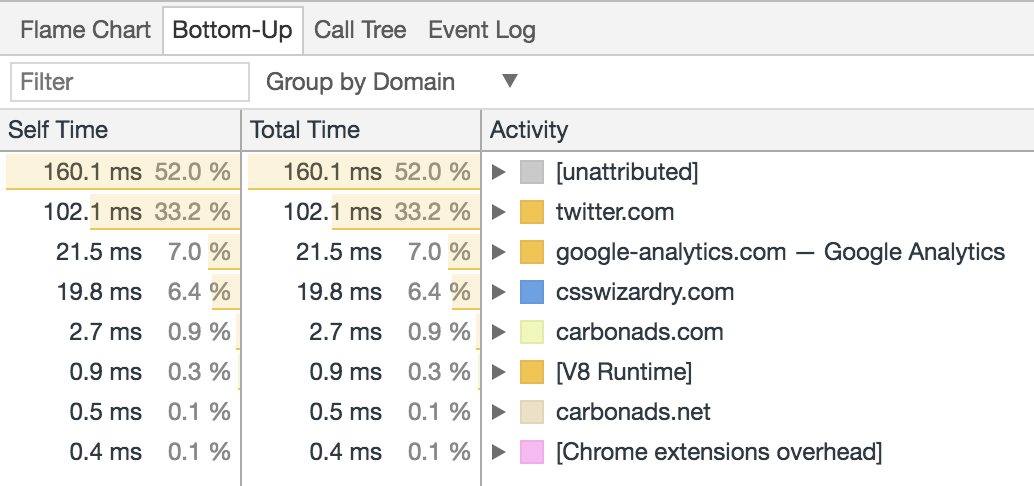
Rightly or wrongly, a lot of performance optimisation is about playing something of a blame game: what, or who, is making us slow? One of my favourite ways of quickly working this out is to make use of DevTools’ Bottom-Up summary of runtime performance.
After you’ve run a Performance profile over your page, you should see a pane with a tab reading Bottom-Up. Head over to this view, and select Group by Domain from the available dropdown. Amazing! Now we can see exactly where our overhead is coming from:
Above, we can see how twitter.com contributes a third of the work that happens
when loading a page on my website. Using this knowledge, we can more accurately
pinpoint problem areas, and begin investigating with a bit of evidence behind
us. We can then take that knowledge, and use it with the following…
As of Chrome 59 (and long before that if you have Experiments enabled), we have the option to prevent requests for specific asset URLs—or even assets on entire domains—from going out. Whilst this doesn’t necessarily simulate any realistic network conditions (the key thing to note with this feature is that it blocks outgoing requests; it does not hit the network at all), it is a great way of seeing what the absence of a particular asset would have on the current page.
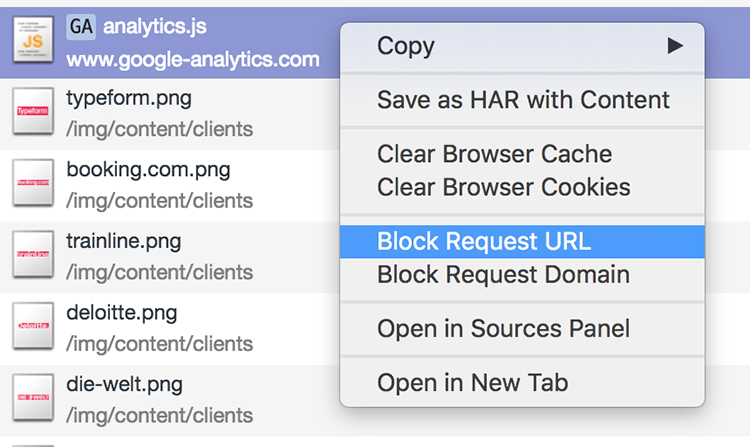
In DevTools’ Network panel, after you’ve run a waterfall chart, you’re now able to to right-click an individual asset and mark it for blocking: you can either block outgoing requests for a single file, or for all files from an entire domain.
I usually use this feature when I’m running performance audits: when I’m profiling a live website, I might get a hunch that a certain third party is causing slowdowns. Previously, in order to verify this, you’d have to remove the third party asset from the source code, roll a new release to a staging environment, and re-run your tests with the asset removed so as to measure your before and afters.
Now, however, you can simply wonder Hmm… I think this particular third party
tag manager is causing us some problems; let me quickly disable it and see what
happens.
In fact, I did exactly this in front of a client only last week to
find that one particular third party JS file was contributing around half
a second of slowdown.
In short, this feature is fantastic for profiling live sites and seeing exactly what happens when we remove third party assets from the page load.
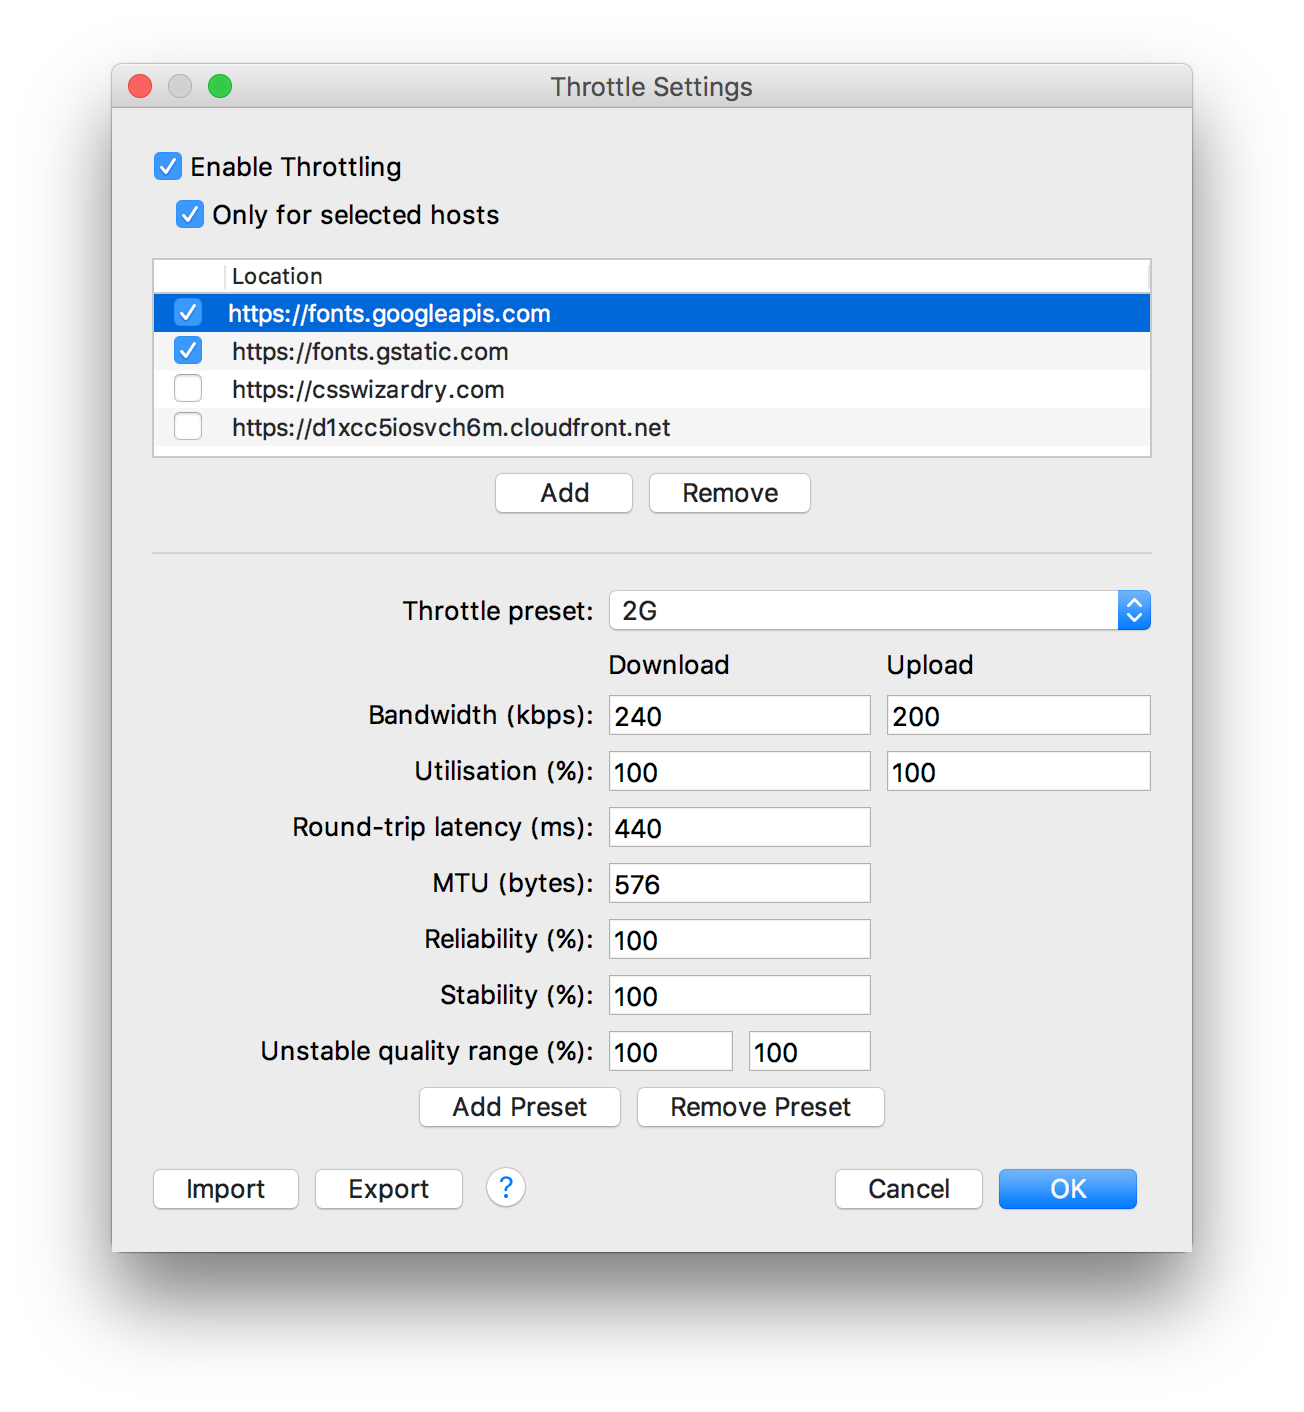
Charles is a great little Swiss Army knife of a tool that I use quite frequently. It allows us to proxy HTTP traffic, observing exchanges between our machine and the network. The bit we’re most interested in right now, though, is its throttling feature. Charles’ throttling capabilities are twofold:
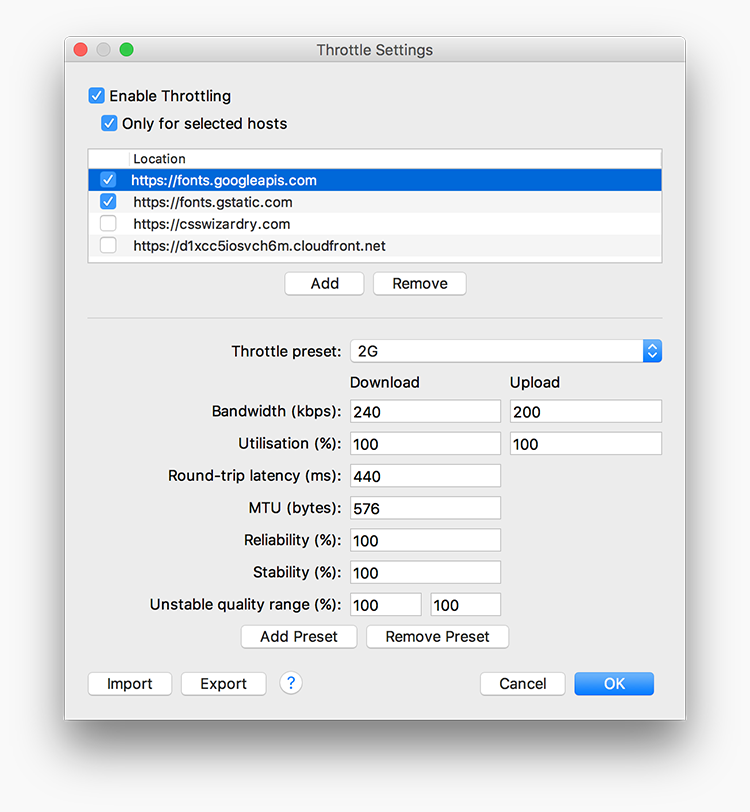
Add a domain to the list, choose or configure a network condition, and begin artificially slowing down traffic only from a specified host.
It’s hopefully fairly self-explanatory, but this is a great way of assessing what would happen if you weren’t necessarily on a slow connection, but if one of your third parties was suffering a slowdown for whatever reason. What happens if Google Fonts is having issues? What happens if Typekit gets DDoSed? Simulating slowdowns on specific third parties is a good way to see how vulnerable we are.
The most extreme of scenarios: what happens if a third party has a complete outage? As rare as this may be, it’s prudent to at least know how your site will respond in the case that a third party you use goes completely offline. Best case scenario, you fail gracefully with minimal disruption; worst case scenario, you go down with it.
A blackhole server can be used to route third party traffic through an endpoint
that effectively makes requests disappear, recreating the effects of a complete
outage (only for yourself, not the entire internet).
WebPagetest have made a blackhole server
available at 72.66.115.13. We can point specific domains at this IP address in
our hosts file, e.g.:
72.66.115.13 platform.twitter.com
72.66.115.13 connect.facebook.net
72.66.115.13 fonts.googleapis.com
72.66.115.13 assets.adobedtm.com
72.66.115.13 fast.fonts.net
Now—if you’ve cleared your browser’s and machine’s DNS cache—you should find that all requests to assets on those domains will eventually time out. This is where we begin to see interesting, and often much more severe, results.
Let’s say you have a render-blocking asset hosted on an external domain, for example:
script that doesn’t have an async or defer attribute, such as Adobe
Tag Manager, or;Because these types of assets block rendering, the browser will not paint anything to the screen until they have been downloaded (and executed/parsed). If the service that provides the file is offline, then that’s a lot of time that the browser has to spend trying to access the file, and during that period the user is left potentially looking at a blank screen. After a certain period has elapsed, the browser will eventually timeout and display the page without the asset(s) in question. How long is that certain period of time?
It’s 1 minute and 20 seconds.
If you have any render-blocking, critical, third party assets hosted on an external domain, you run the risk of showing users a blank page for 1.3 minutes.
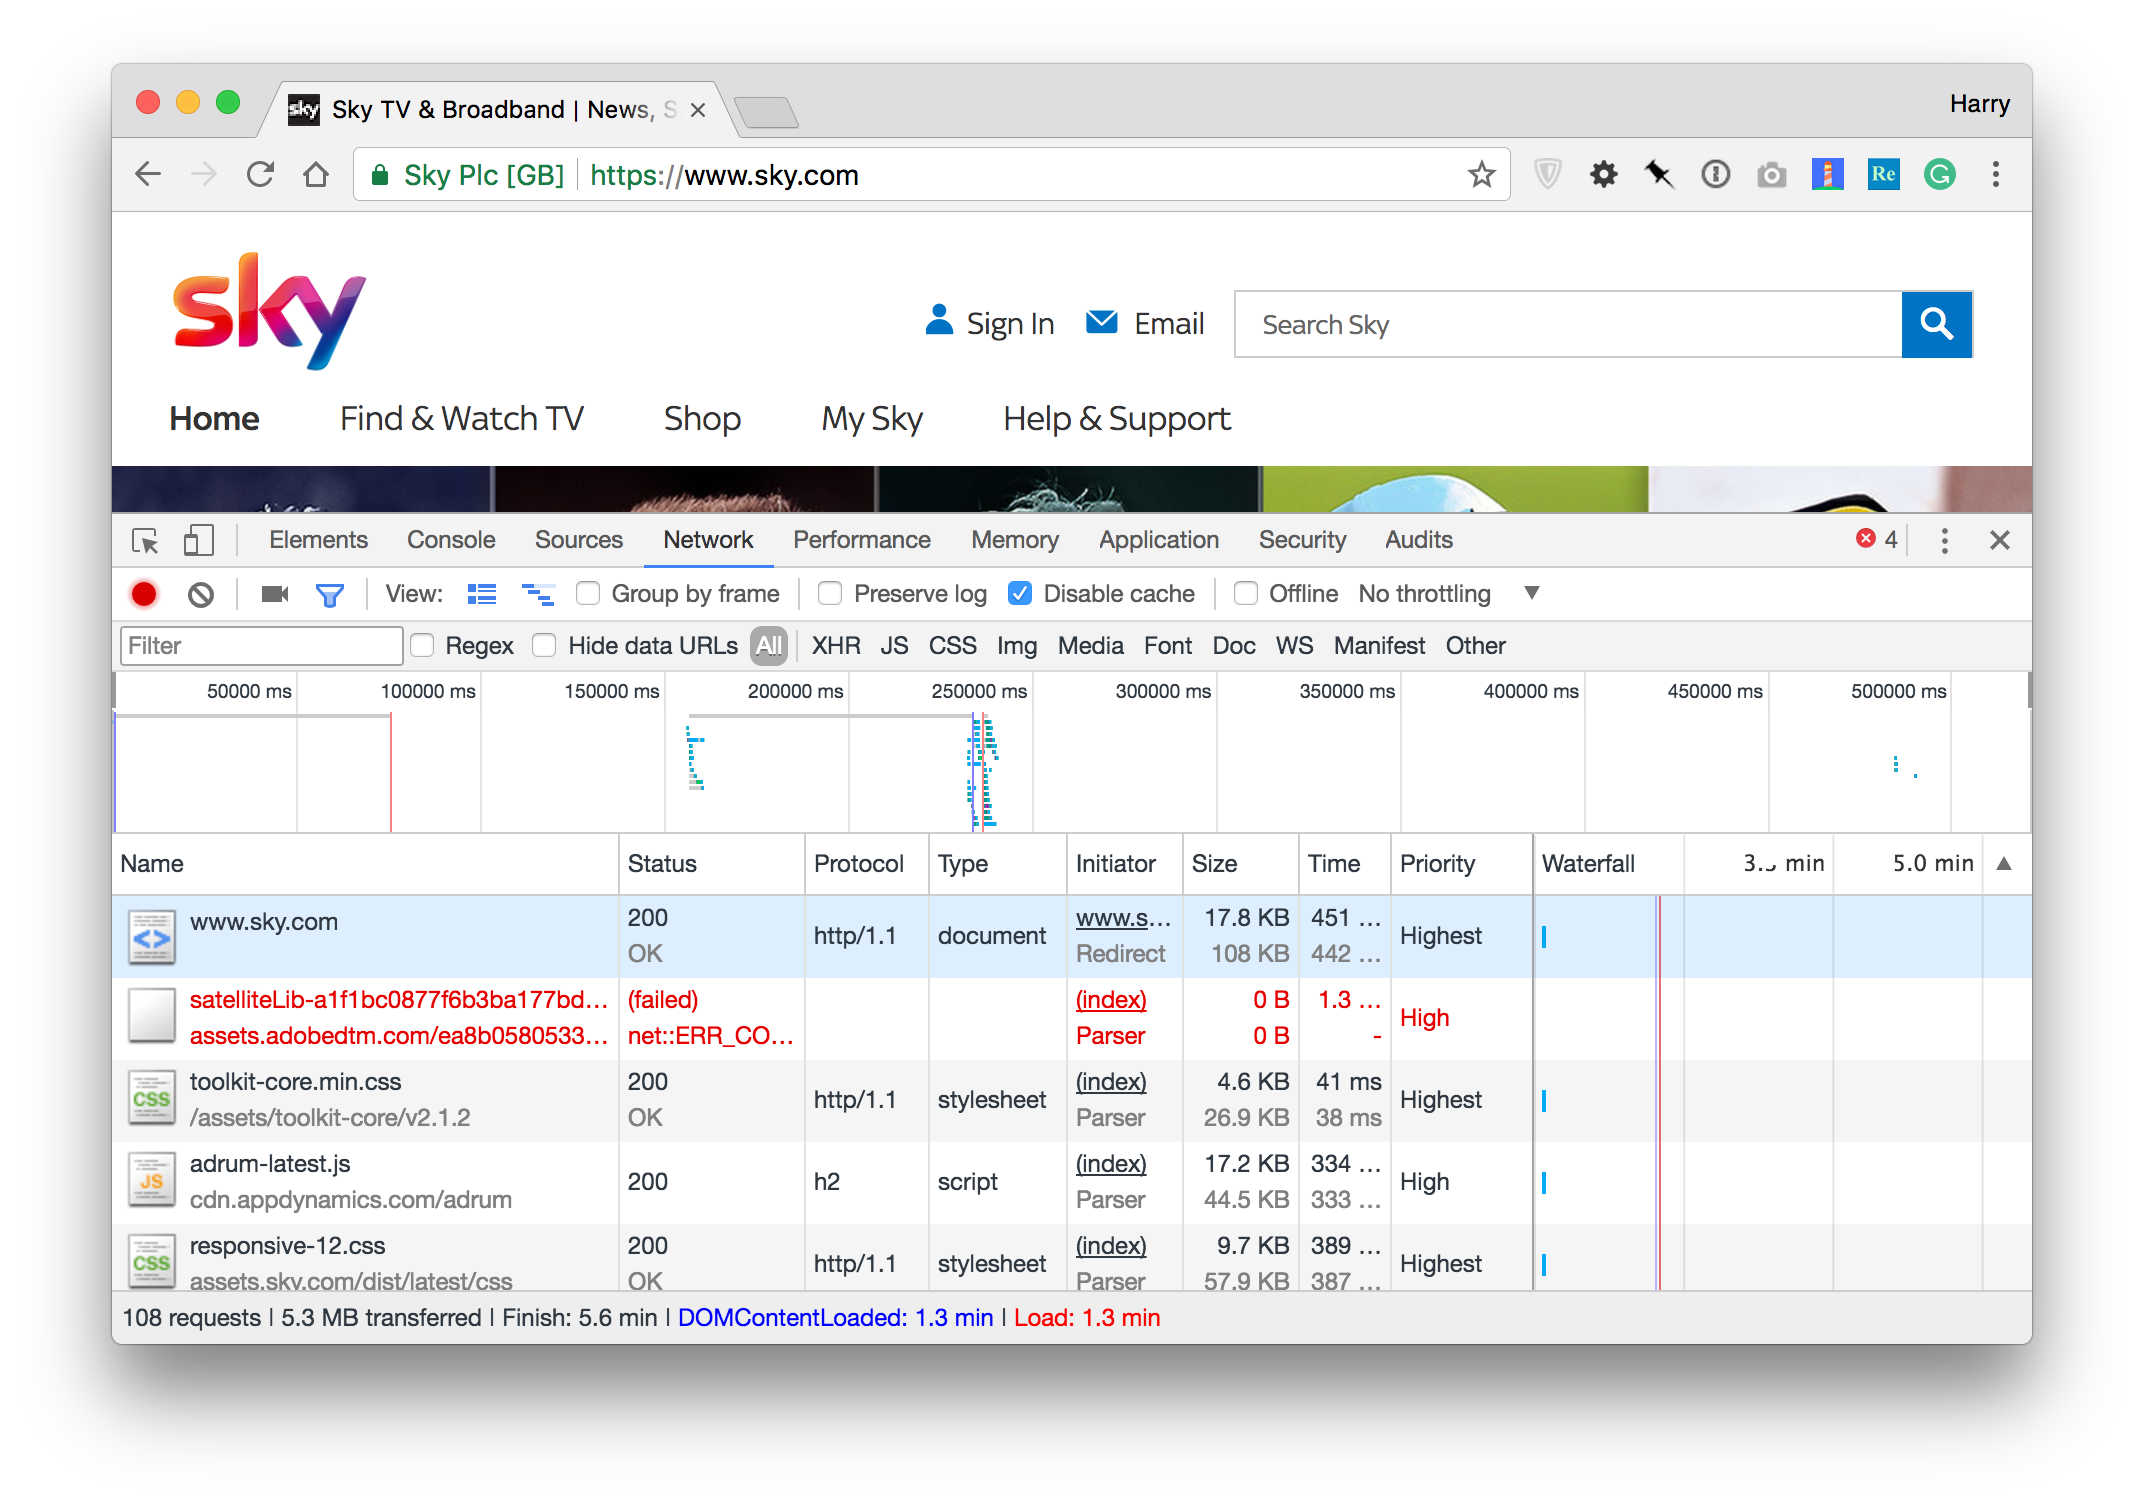
Below, you’ll see the DOMContentLoaded and Load events on a site that has
a render-blocking script hosted elsewhere. The browser was completely held up
for 78 seconds, showing nothing at all until it ended up timing out.
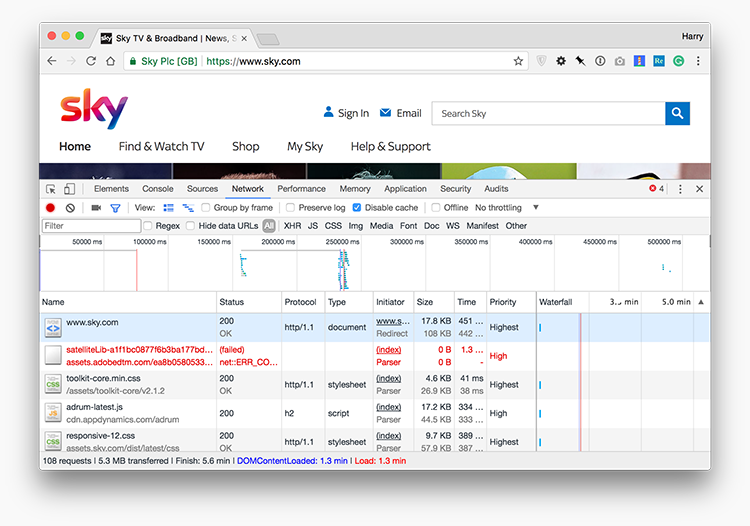
DOMContentLoaded and Load
event when Adobe Tag Manager is offline. View full
size/quality (375KB).It’s very important to point out that this isn’t necessarily the third party’s fault. The behaviour outlined above is expected: it’s how web pages and browsers work. What we’re doing here is not apportioning blame, but learning about how resilient we are if one of our third parties goes down.
Oftentimes, we don’t consider the implications or ramifications of such scenarios, and we rarely realise just how severe the outcomes can be. I would wholeheartedly recommend identifying and then testing any critical third parties you have hosted on external domains.
In the case of something like a Google Fonts CSS file, we should be using a more
robust and failsafe font-loading technique; in the case of JavaScript, we should
try utilising async or defer if possible.
Like it or not, third party providers are a necessary evil in almost all development projects, and if we’re going to entrust parts of our site or product to others, we ought to have a very good idea of what happens when things go wrong. Stress-testing third parties is a standard part of any of the bits of performance work I undertake, because the ramifications can be huge. And again, this isn’t us blaming the providers: it’s finding out how well we handle failures.
Ryan Townsend wrote something of a follow-up post, How 3rd Party Scripts can be performant citizens on the web.
N.B. All code can now be licensed under the permissive MIT license. Read more about licensing CSS Wizardry code samples…
Harry Roberts is an independent consultant web performance engineer. He helps companies of all shapes and sizes find and fix site speed issues.

Hi there, I’m Harry Roberts. I am an award-winning Consultant Web Performance Engineer, designer, developer, writer, and speaker from the UK. I write, Tweet, speak, and share code about measuring and improving site-speed. You should hire me.
You can now find me on Mastodon.
I help teams achieve class-leading web performance, providing consultancy, guidance, and hands-on expertise.
I specialise in tackling complex, large-scale projects where speed, scalability, and reliability are critical to success.